Generate a software architecture diagram from a codebase
Usually a developer or an architect, for one repository first
Bind one system to its repository and let the code plugin map what is inside: a layered board drawn from the code on your machine, kept current by sync.
Fig. 01Connect a board to the Code Plugin
The problem
Every team has drawn its architecture diagram at least once, and every one of them is a picture of the day it was drawn. The code moved; the boxes did not. Drawing it again by hand is the job nobody has time for, so the diagram that exists is the one nobody trusts.
A diagram worth having is read from the code, redrawn when the code changes, and deep enough to open a box and see what is inside.
How it goes
The same steps the product’s playbook walks. Each one shows the screen at that moment and opens the video there.
Start on the landscape
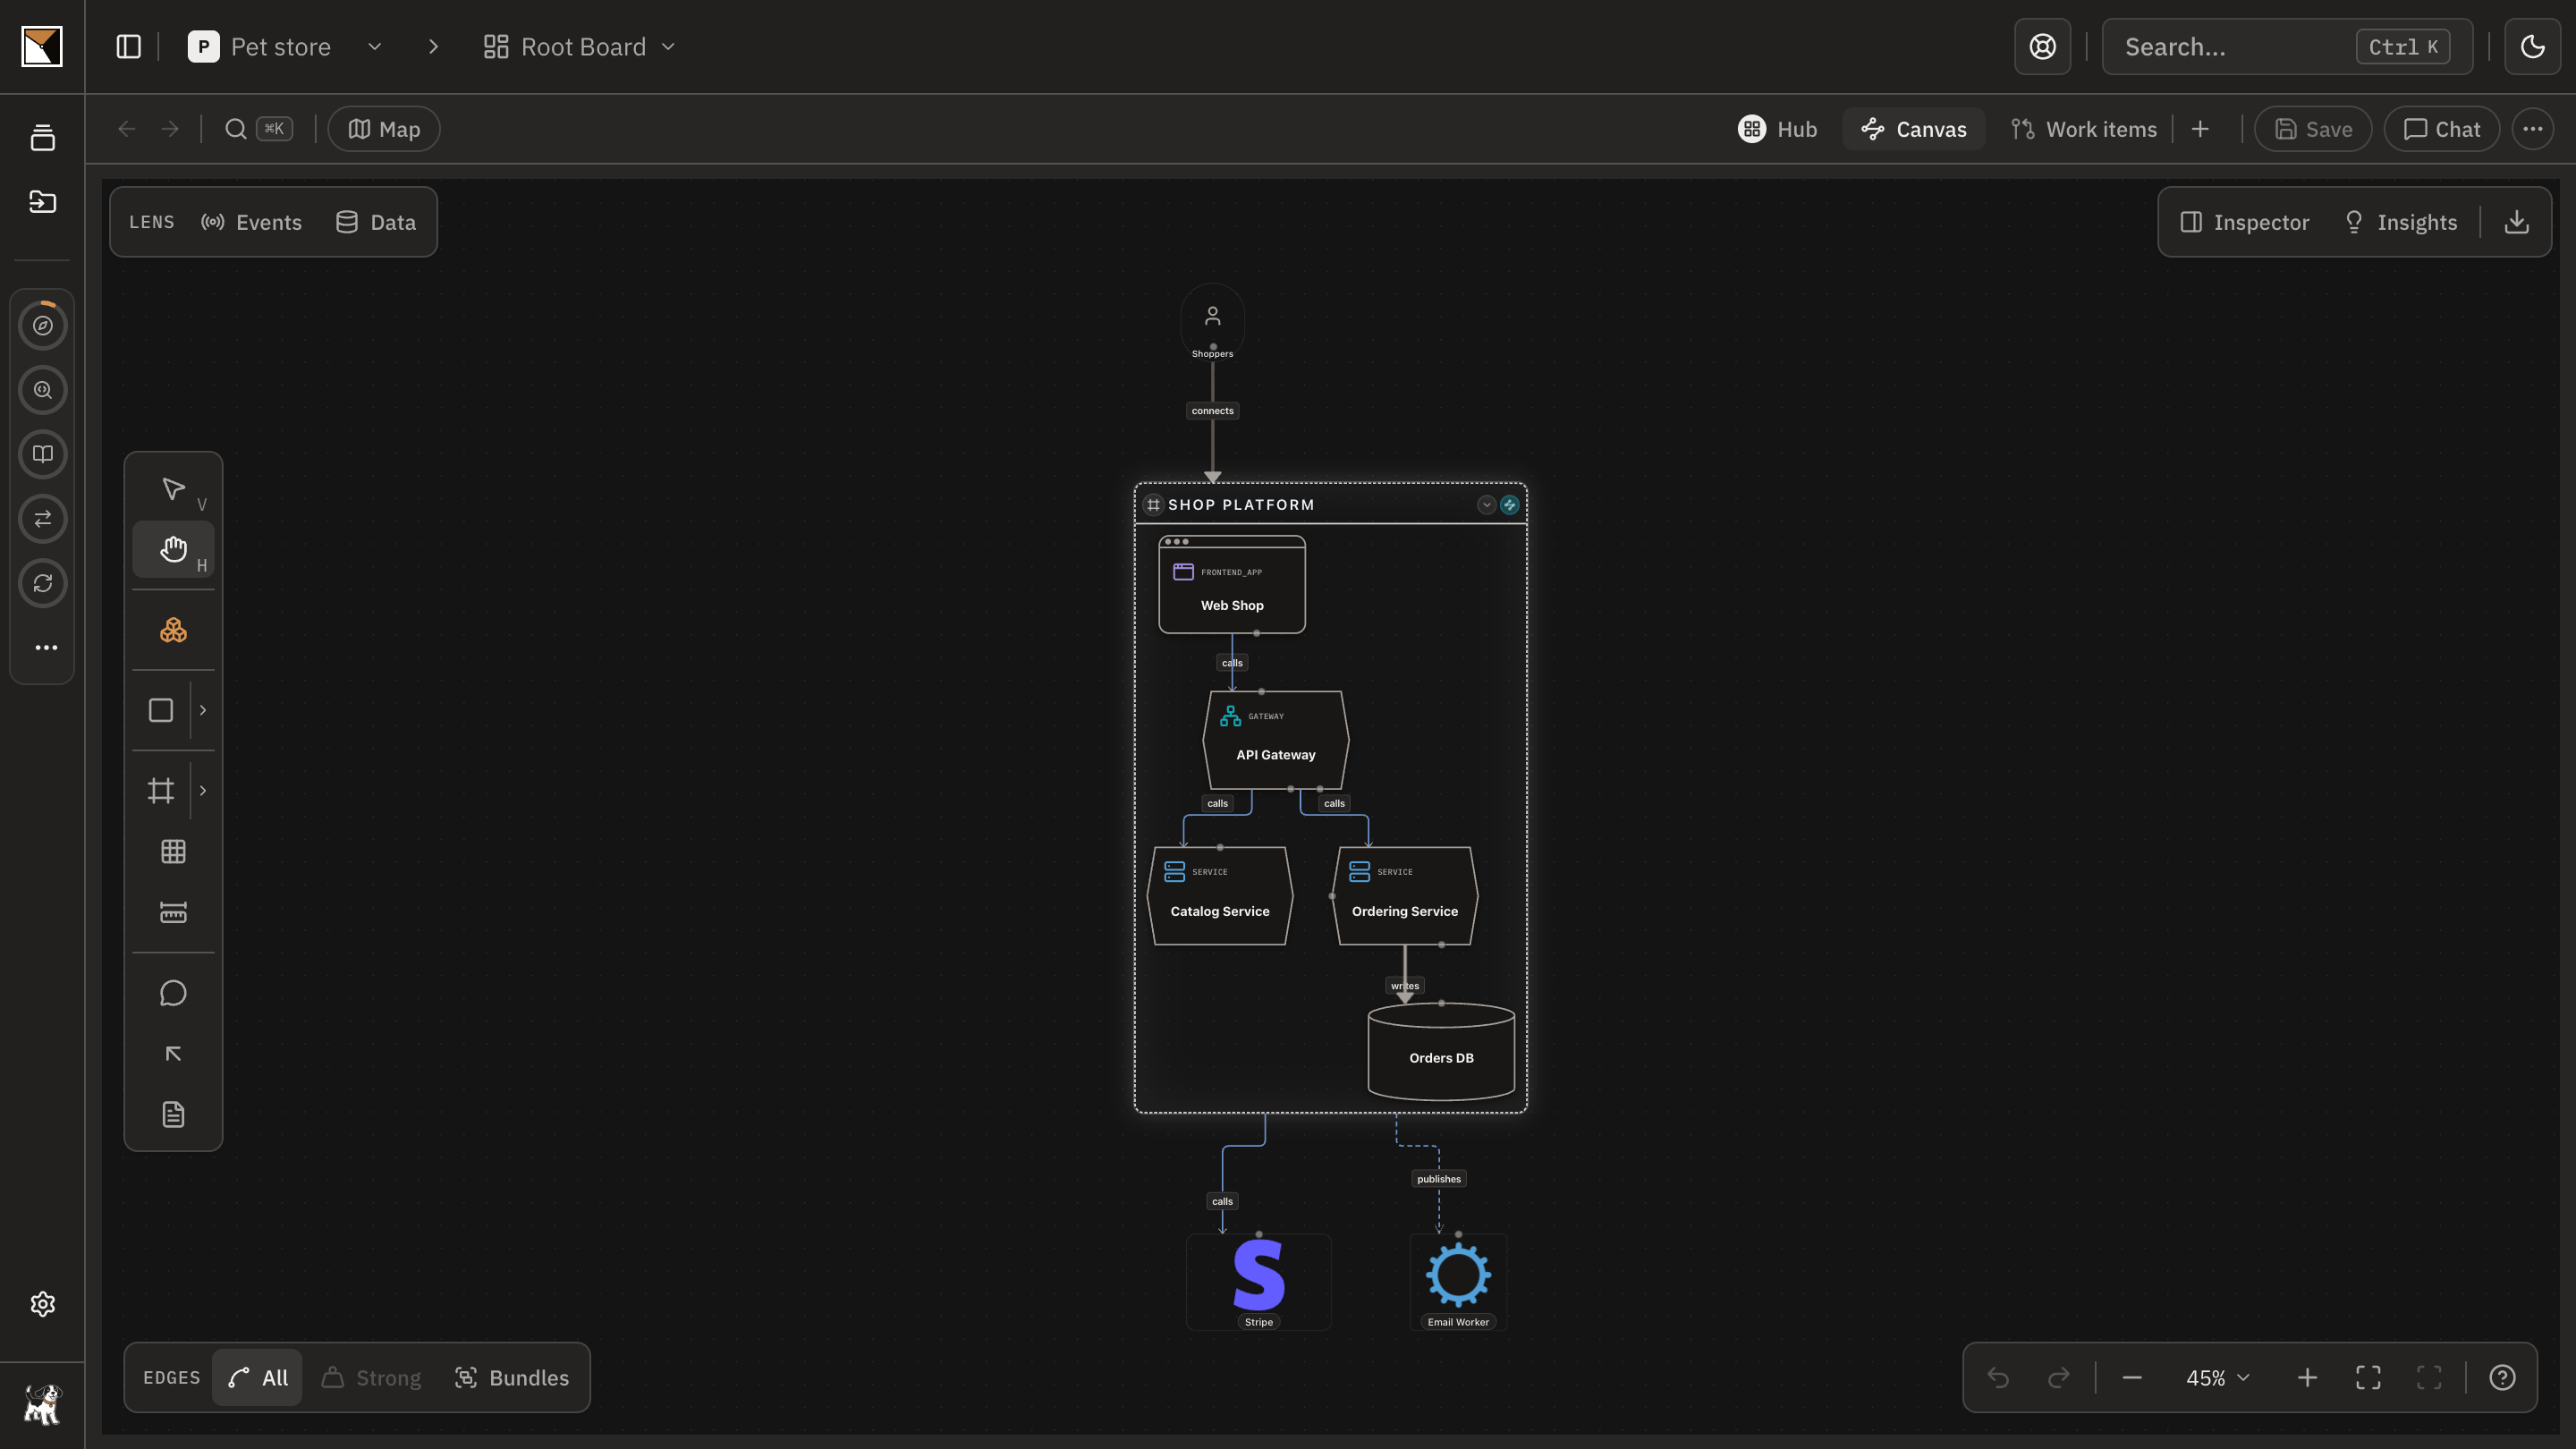
Pick the system that is backed by a repository. On the landscape it is one node among the others you run, buy or integrate.
Make it an app
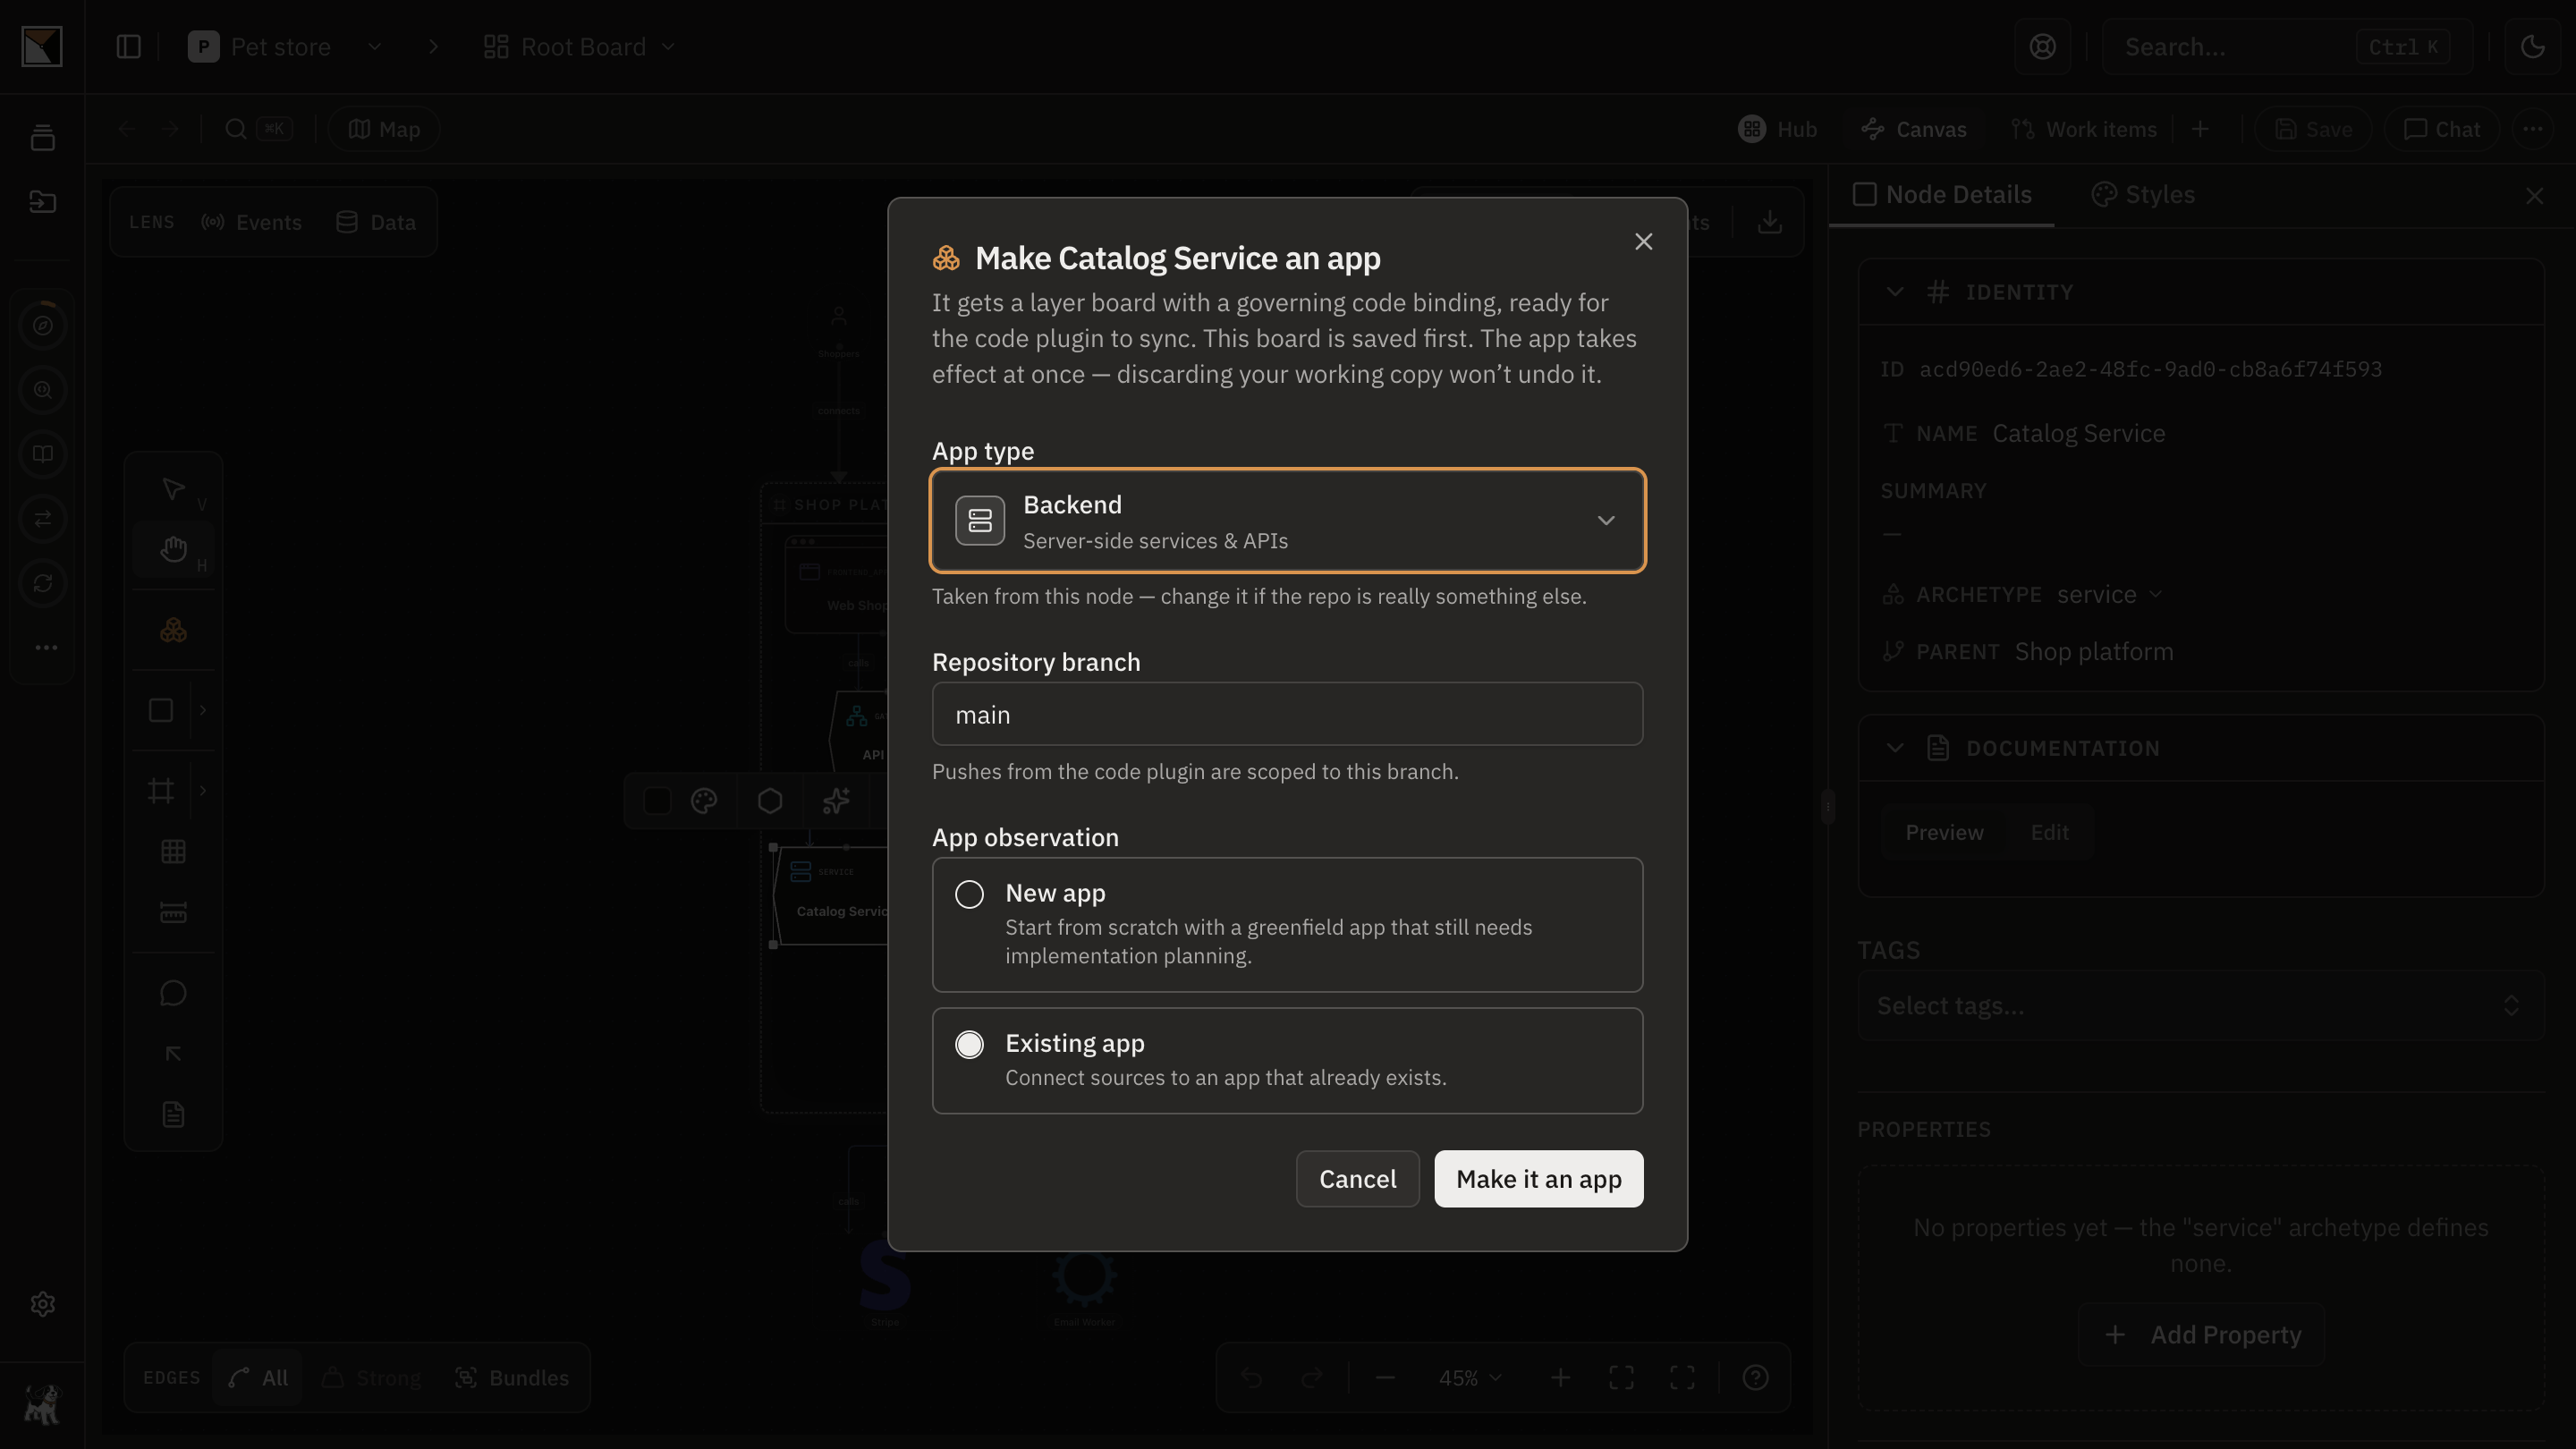
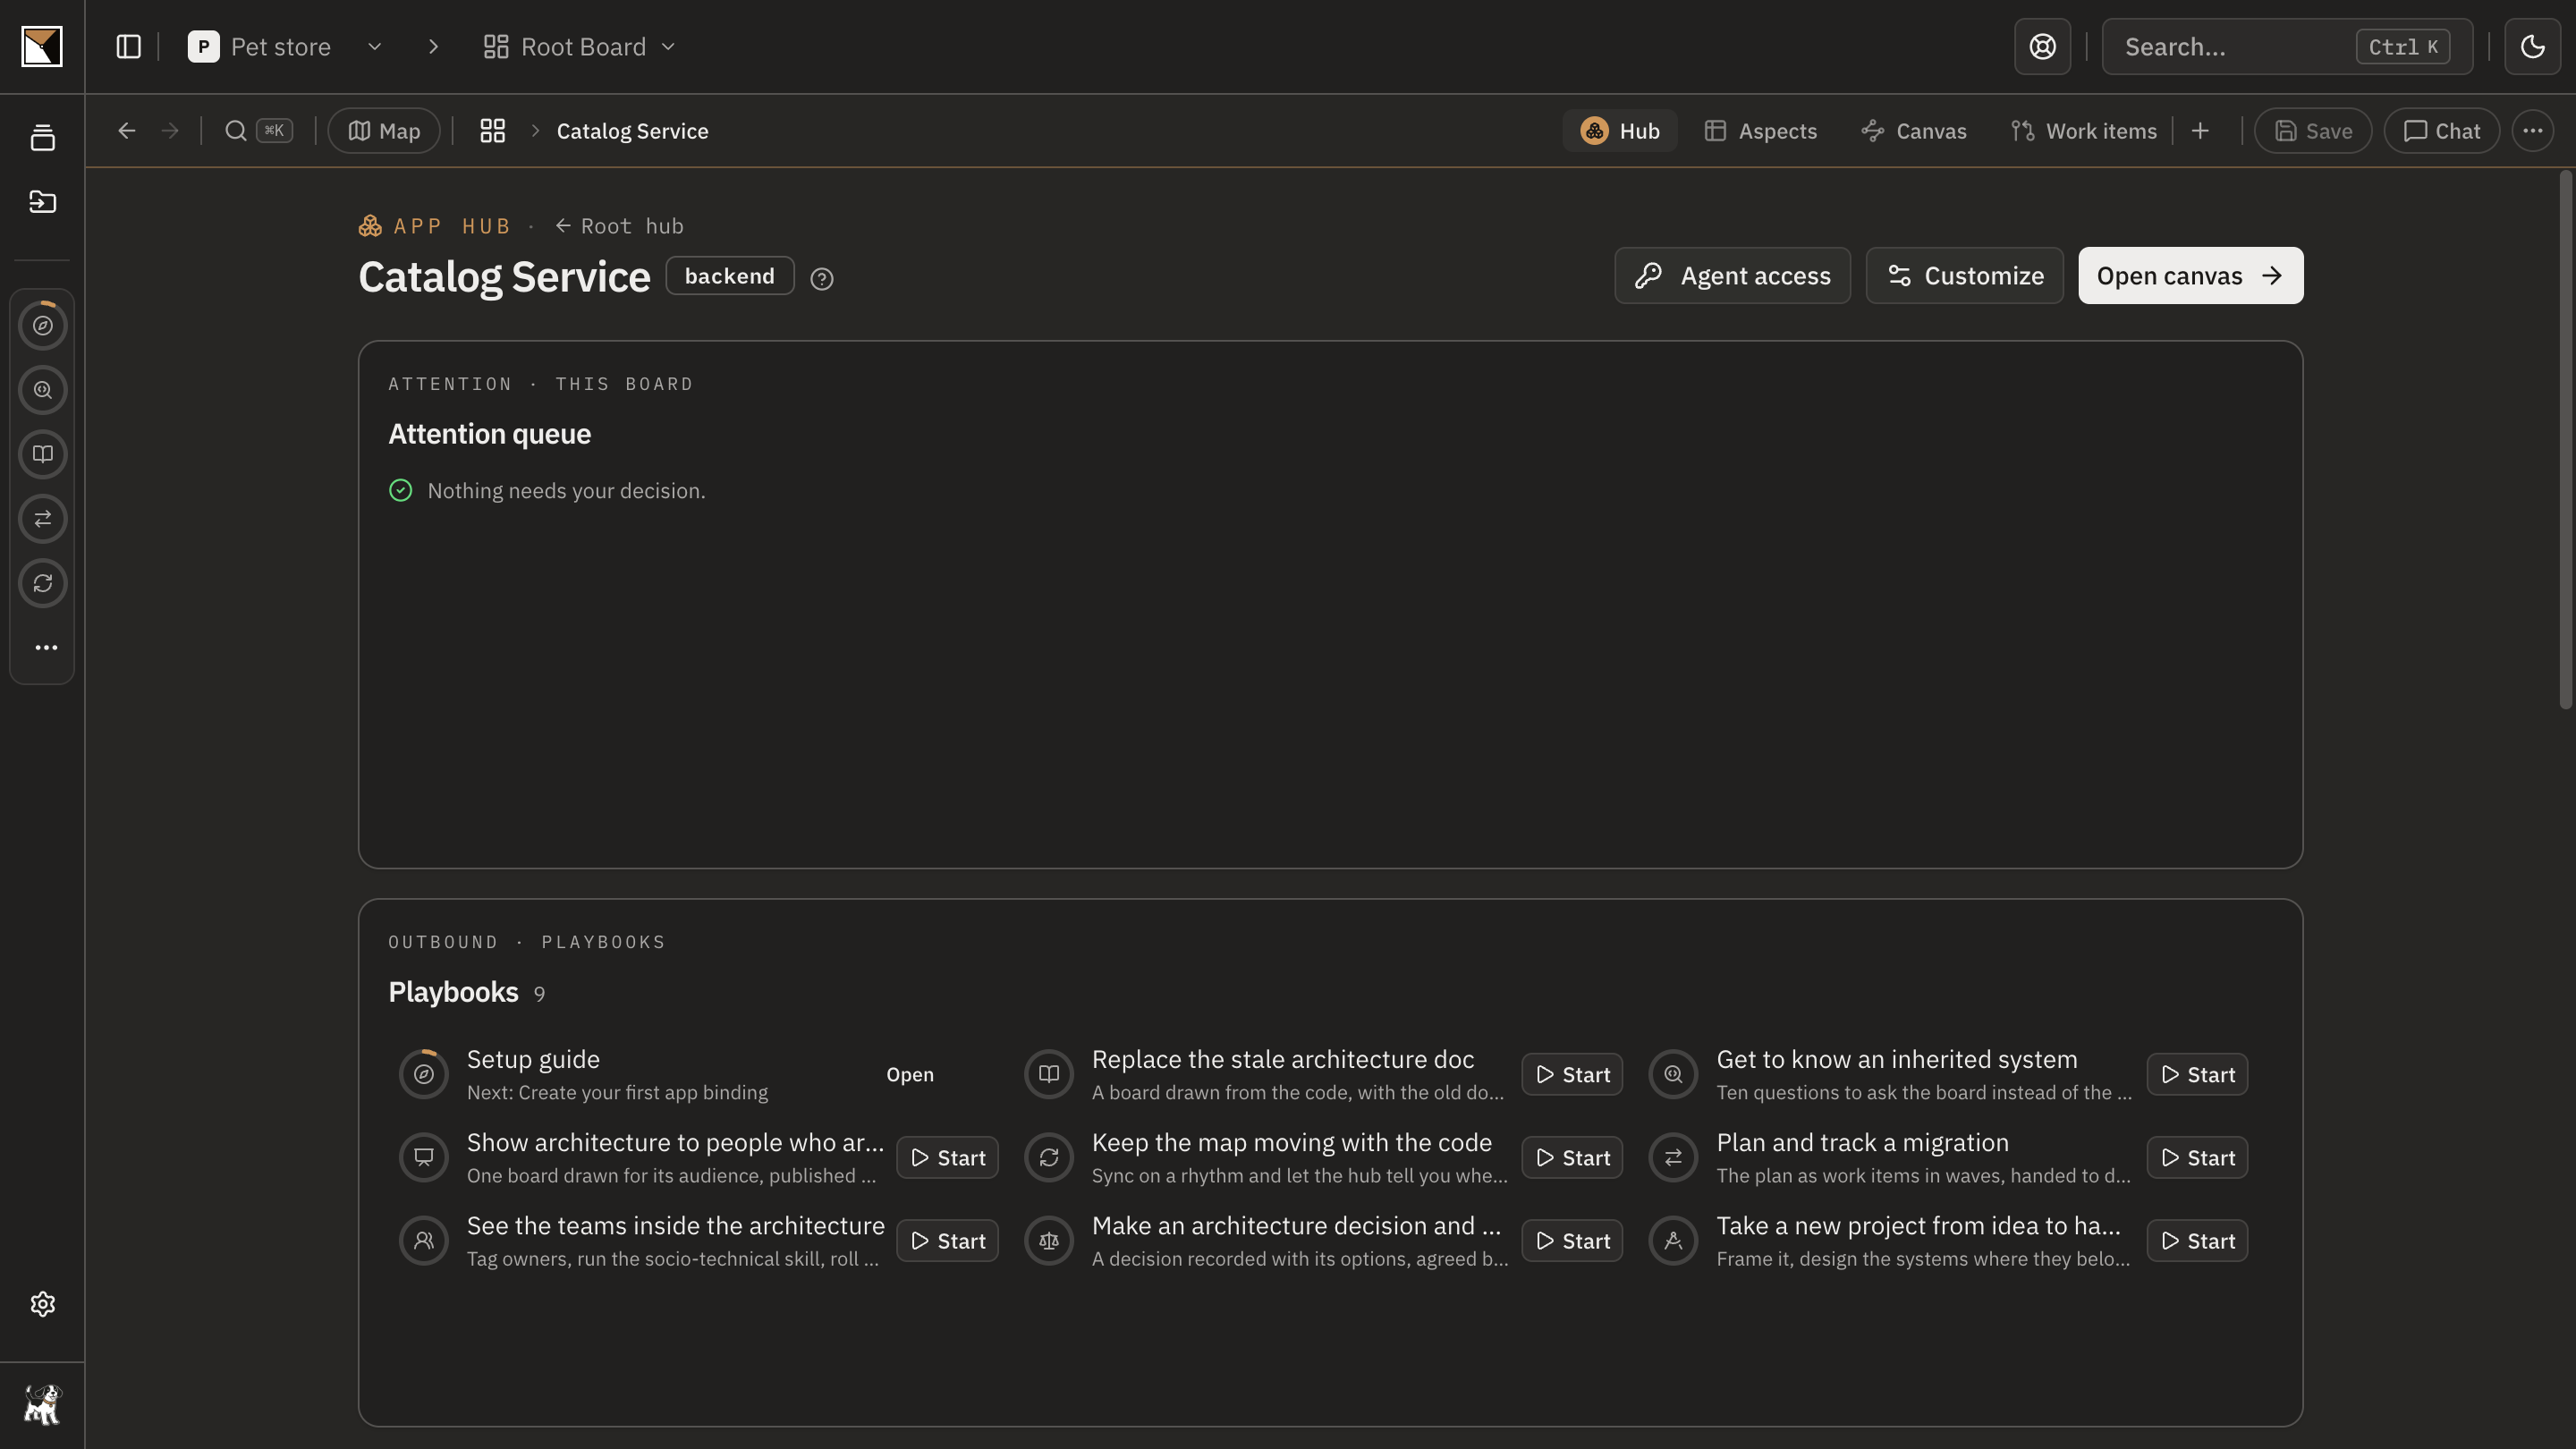
Right-click its node and make it an app: choose the app type and the branch the plugin syncs. Its layer board now holds the binding, ready for the plugin.
Connect the plugin
In the repository, the code plugin signs in through the browser and picks the board. The analysis runs on your machine; only derived metadata is pushed, never your source.
Analyse and sync
One command maps the repository into a graph on disk and pushes nothing. The next sends that graph to the board, layer by layer.
Read the board
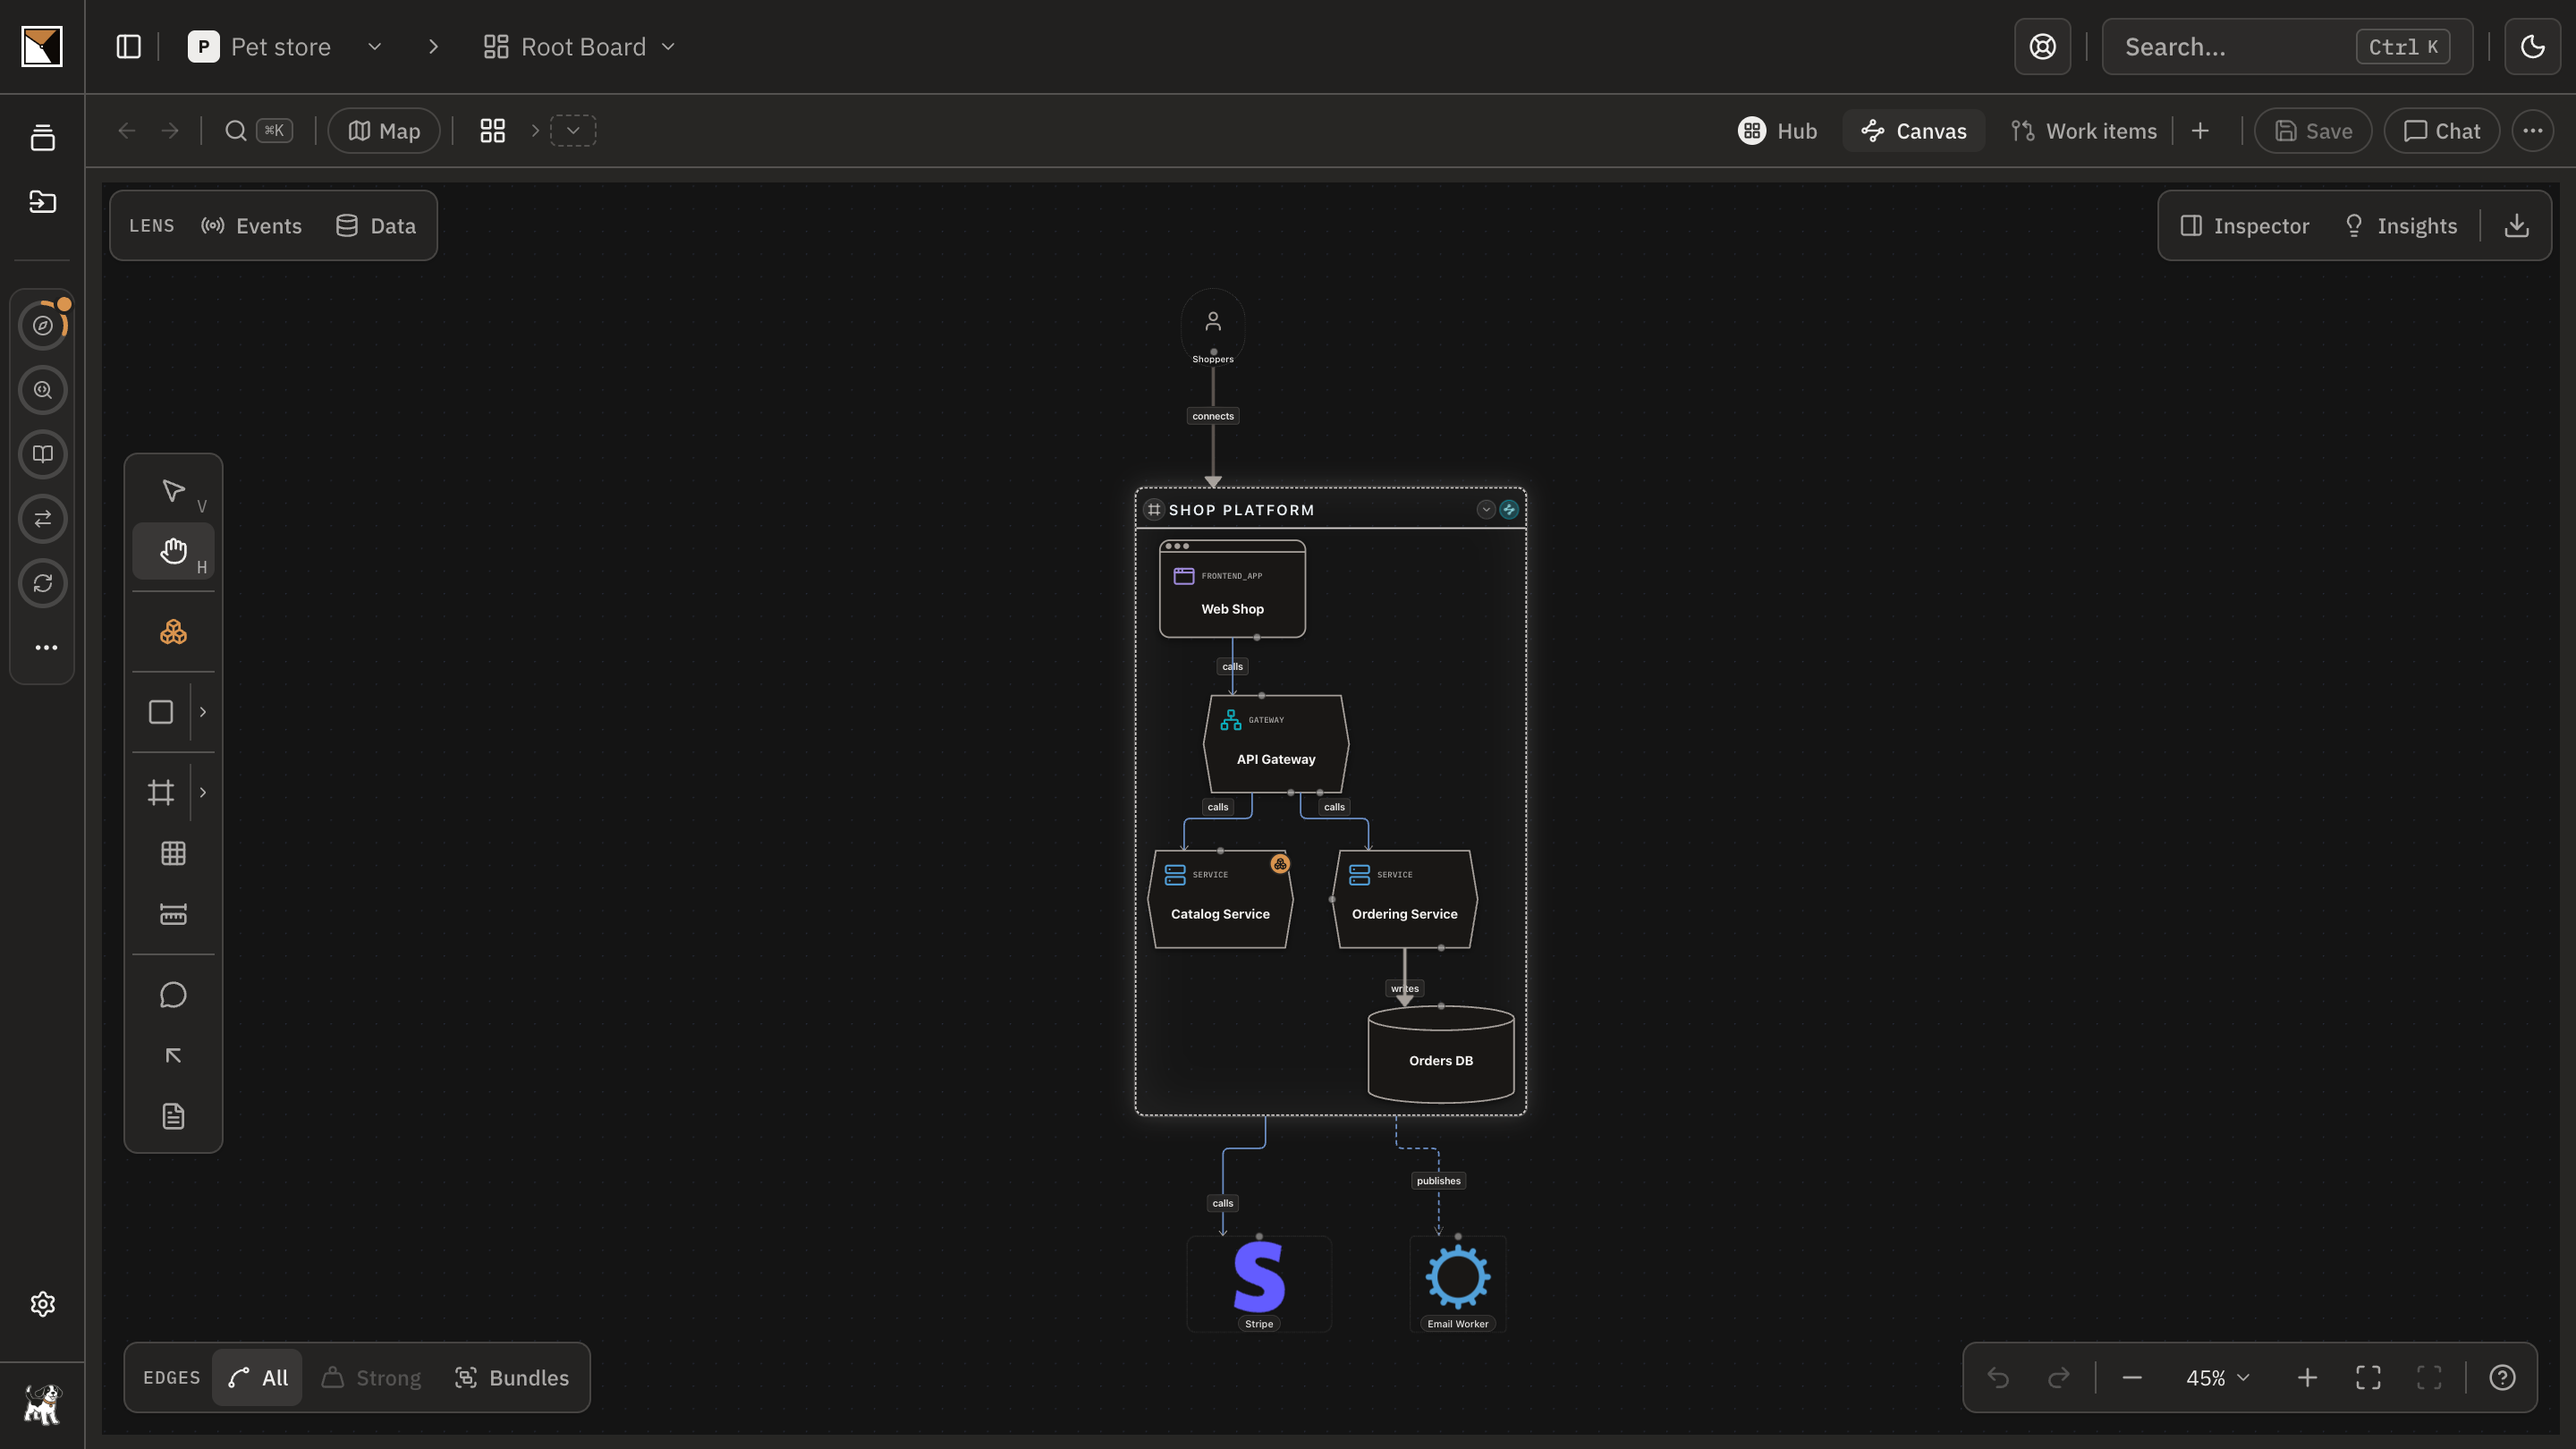
Each part of the stack is a node and each dependency an edge. Open a node to drop into its layer, and run the sync again whenever the code moves.
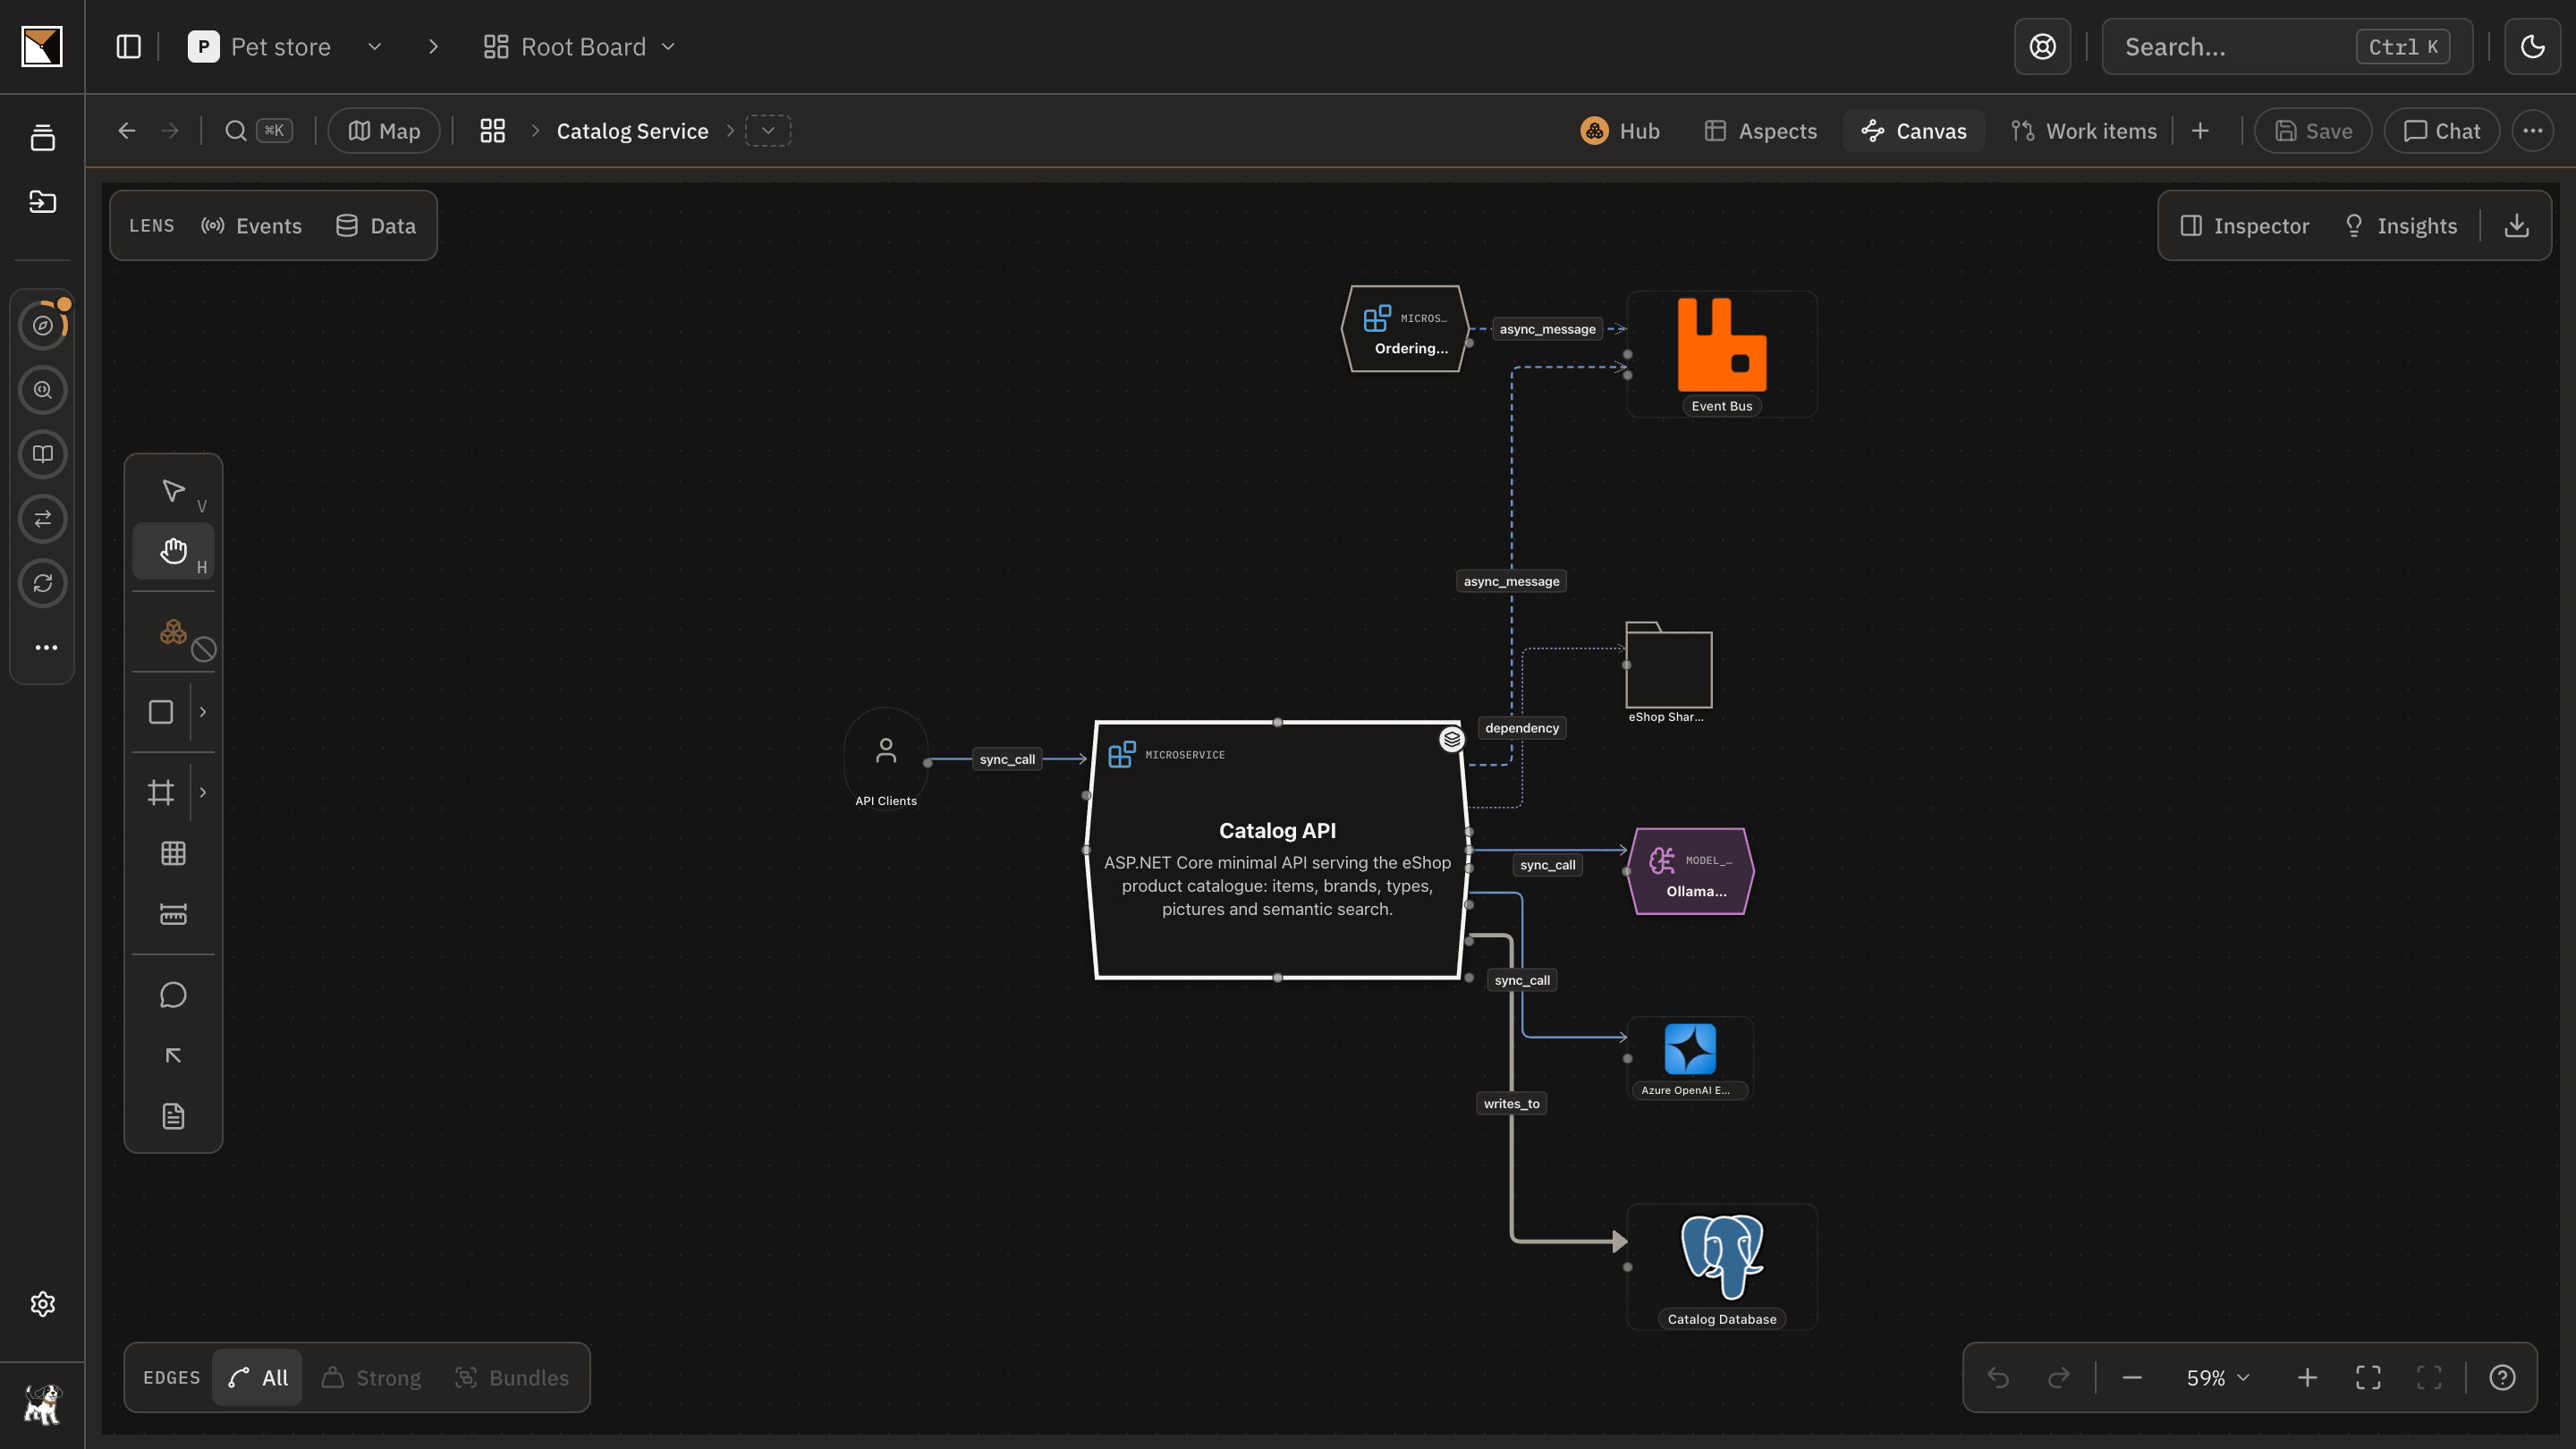
- Done
End proofDone when the system's board shows the graph the plugin mapped, and the next sync moves it with the code.
Works with
- Repositories
- One per app; JavaScript and TypeScript, Python, Java, Go, C#, Ruby, Rust, PHP, Kotlin, Swift and Scala, with monorepos split into apps.
- Hosts
- Claude Code, Codex and Cursor on your machine. The analysis runs locally and pushes derived metadata, never your source.
- Boards
- A landscape of the systems you run, with one app board per bound repository and a layer for each part worth opening.
- Plans
- Mapping and syncing a repository runs on the Free plan.
Where it stops
- The board shows what the analysis can read: the languages and file types the plugin supports, within the files the repository holds.
- A diagram drawn from code shows structure, not intent. Why it is shaped this way is a decision a person records.
- The map is as current as the last sync; schedule the analysis so it never falls a week behind.
Why not a diagram, or a code browser
A diagram shows
Boxes you drew, true the day you drew them, and nothing to open inside a box.
A code browser shows
Files and folders, and the structure above them left for you to infer.
ProvenMap shows
A layered board read from the code, redrawn by sync, with a landscape above it where this system sits among the others you run.
Walk through it
- Getting Started: Plugin or Chat
Every command and decision in order, in the docs.
The features behind it
Start with one system
Map a real system and see the architecture around it.
Open one repository and run the code plugin. No migration, no rollout, no diagramming.
No credit card · Analysis runs locally in your own session · Self-hosted available
See the four commands to your first board →
Or for writing on architecture that stays connected across systems.